Inflation remains at the top of everyone’s mind. As we move into this new week, CPI is on deck for release on Tuesday, February 14th at 13:30 GMT. Happy Valentines Day anyone? And, as I have mentioned previously, while it is not the Fed’s preferred inflation gauge, it is the one that the media continues to drone on about.
The previous release saw CPI cooling to 6.5% (YoY), continuing a pretty consistent drop from over 9% earlier in the year. The expectation is that we saw further decline to 5.8% in January. But, more important is the Core CPI MoM figure, and last month’s was revised upward from 0.3 to 0.4%. The expectation is that we saw 0.4%, once more, in January. So, are the doomsayers finally right? Will we see CPI surprise to the upside and, along with the upside surprise in jobs numbers last month, see the Fed push a 50 or 75 bps rate hike next month?
I wouldn’t be too quick to jump on that train. As I have previously discussed, last month’s upside surprise in the jobs number wasn’t the whole story, yet it is precisely that which the doomsayers are using as support for CPI to start increasing again. Remember, wages showed the smallest growth in avg hourly earnings in the past four months while missing the expected 0.4% rise as well. And this all came after the previous month’s numbers were revised downward. So, while the overall increase in jobs is something to pay attention to, the Fed is really interested in wage growth. Seeing it slow down signals to the Fed that its policy is having an effect which makes them less likely to jump back up to the aggressive rate hikes that we saw through the last half of 2022.
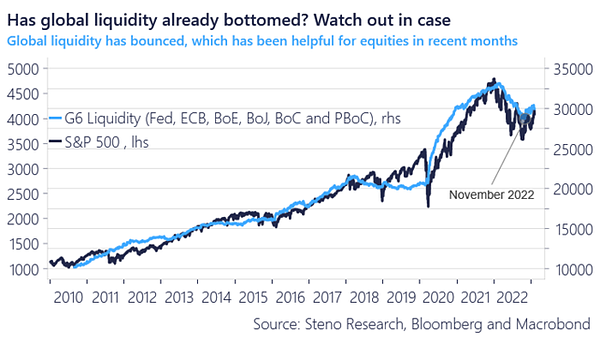
As you’ll see below, the dollar has been bid up as people are expecting to see a strong CPI print. Traders in crypto are used to, and this very well may just be, a “buy the rumor, sell the news” event. As Andreas Steno Larson points out, global liquidity may have already bottomed in November 2022. With the BOJ and PBoC printing (these are the numbers 2 and 3 largest economies), it may just be a matter of short time before the US and its western counterparts start doing the same. This would be in-line with my discussions throughout Q4 of last year and into this year.


The US Dollar (DXY)
We can note that the daily Stoch RSI is almost topped out in overbought and RSI is nearing overbought. This is happening while price is nearing the weekly pivot. So, although it has broken out above the daily pivot, the weekly pivot remains the real resistance we want to see hold. It is possible that we could see the DXY wick up into the 104.792 area. But the more that the weekly candle holds, the more likely the top is in and the dollar will continue to fall lower.
Bitcoin Futures (BTC1!)
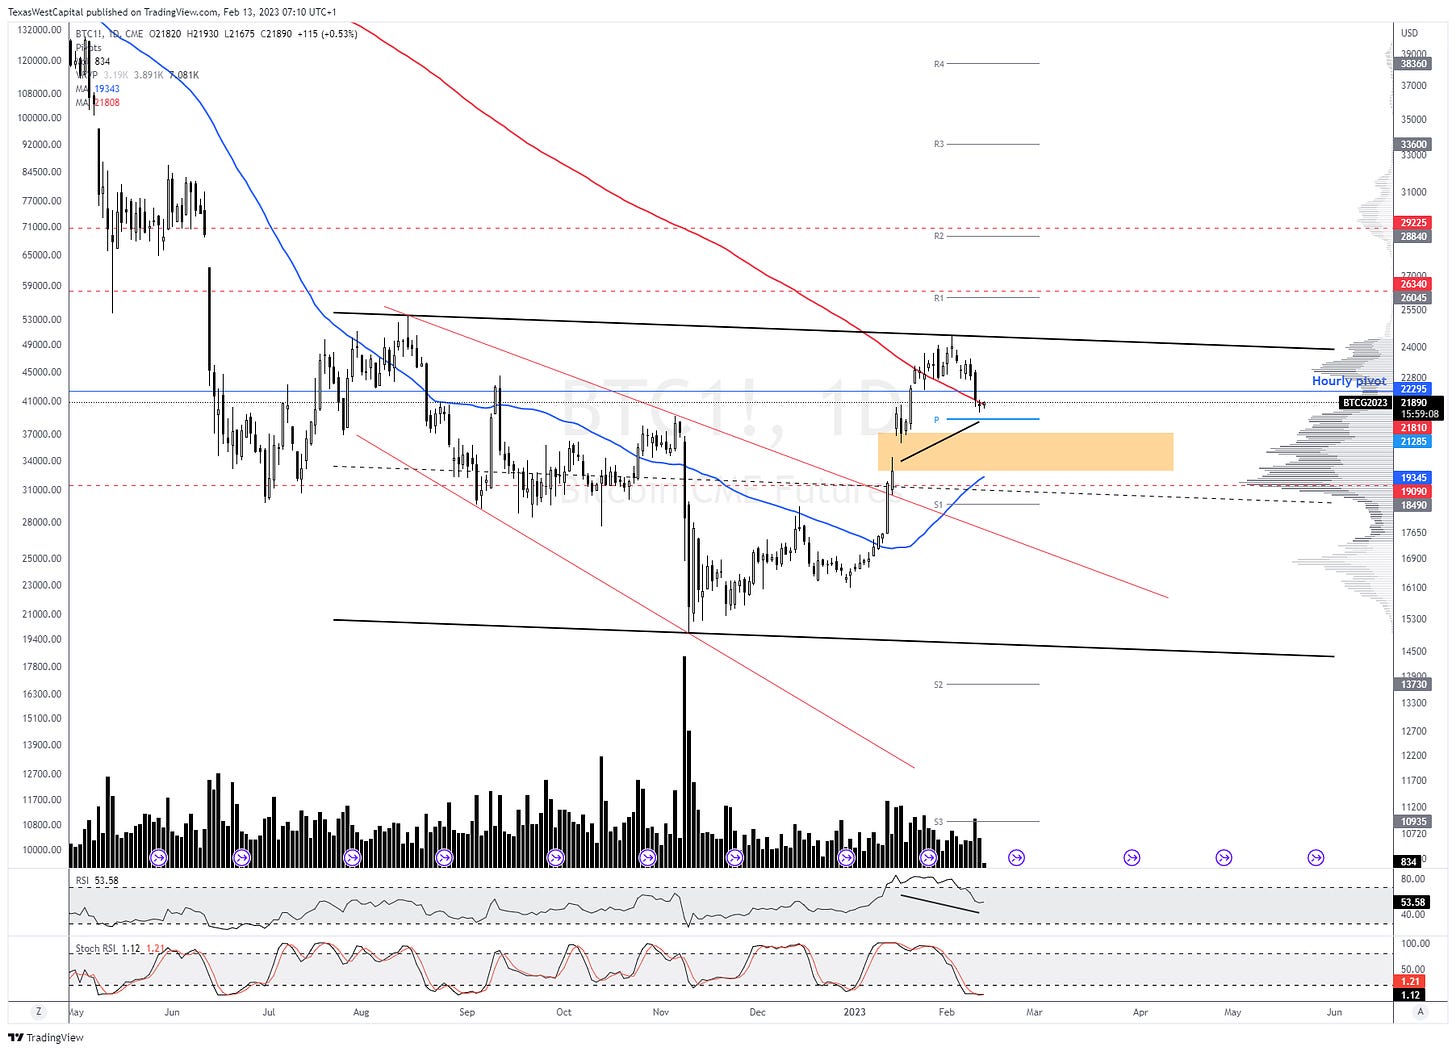
Taking a look at the Bitcoin futures chart at the CME, we can note the weekend gap that everyone is so concerned about outlined in orange. While I can’t guarantee that price won’t push that low, what I can say is that it is a simple weekend gap which doesn’t hold a lot of power. There are multiple different types of gaps and only some of them will usually see a fill. Weekend gaps are normal, however, so they don’t have that same effect. Traders should also be paying attention to the HVN (high volume node) on the left hand side of the chart. Because price is above it, we can count on the market buying any push into it. Although that doesn’t guarantee that price won’t fall through it, we should expect that it will take a lot of extra effort to do so.
We can also note the hidden bullish divergence as price is catching a bid just prior to the daily pivot. The 200 MA (red line) is also providing support for now, with the 50 MA (blue line) curled up pretty sharply and nearing a golden cross. As long as the daily pivot holds as support we should be looking higher, initially at the ~26340 level on the CME. But a breakout above the large descending channel resistance is likely to see price fly through that and into the ~$30K area, which increases the odds that we may see price continue to push into the $40K area before initiating a proper pullback. Breaking out impulsively above the weekly pivot, and closing above it, will be very bullish.
My Mission in 2023
My mission this year is to help 10,000 traders become consistently profitable. To that end, TWC is currently offering 1 month of Tier 3 access for only $19.99! That’s a savings of $180 off the normal month-to-month price! No autorenew, so there’s no need to worry that you will be charged again in a month if you don’t remember to cancel. But this is the final week of this promotion. If you do like what you see and choose to stick around, we will be offering you a pretty sweet deal. But if not, that’s okay, too. Just make sure you absorb all the content you possibly can while you’re with us.
Click here to sign up with TWC today!
Chart of the Week (HG1!)
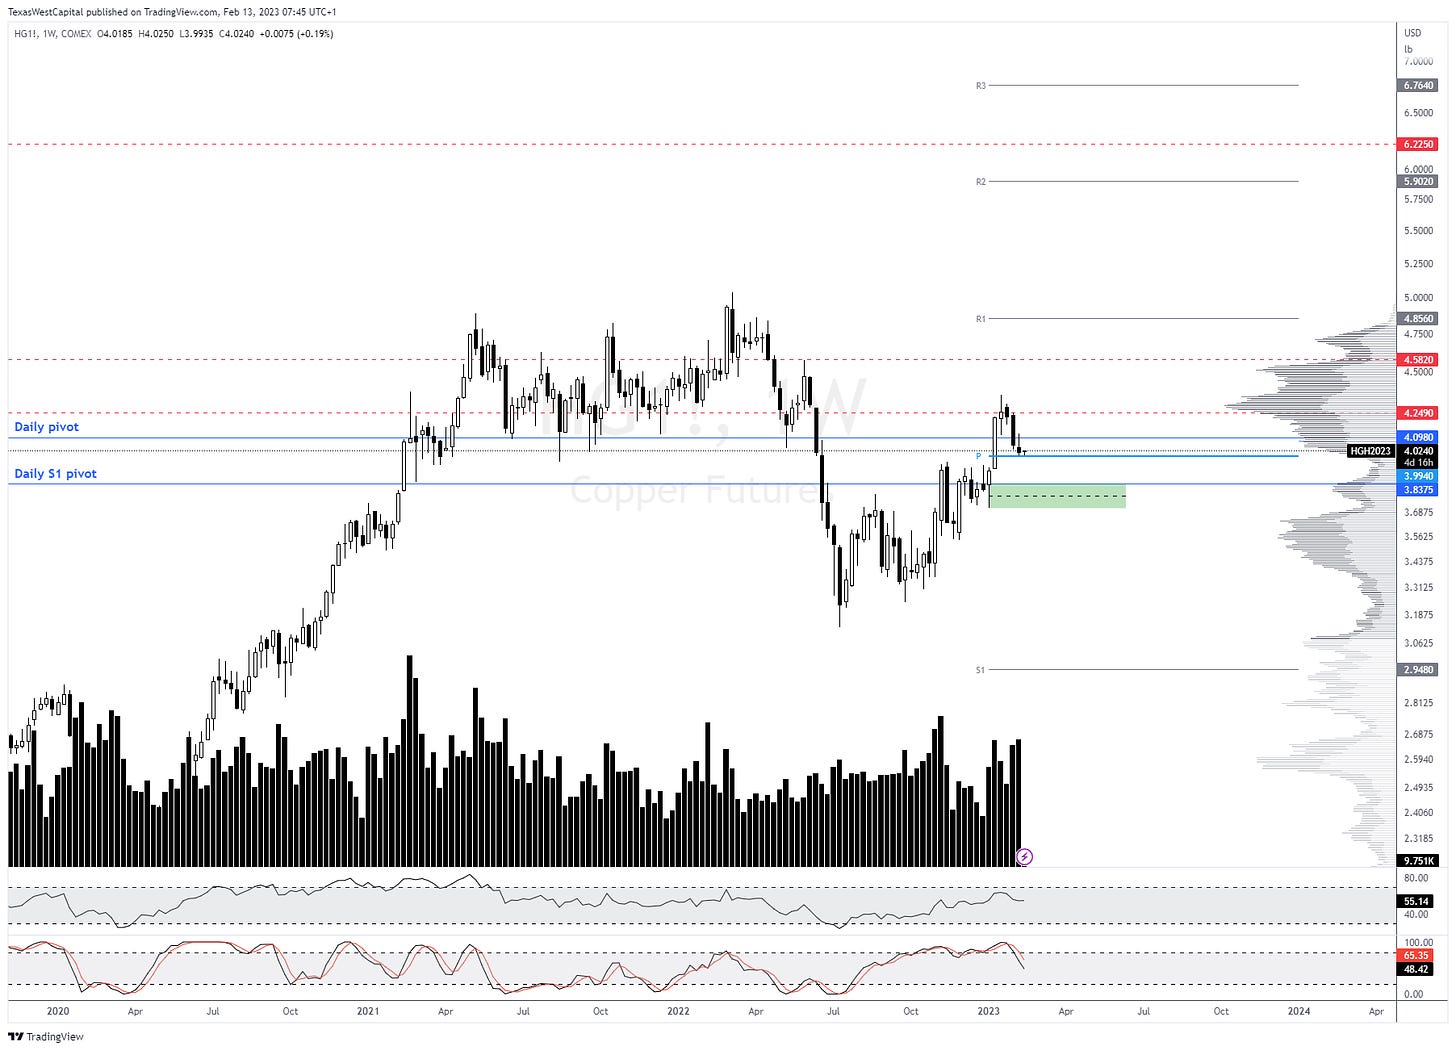
Copper futures are looking interesting this week. We can note that they rallied and broke out impulsively above the weekly pivot, and then pulled back to the pivot. Looking at the previous two weeks of price action and volume we can see a large supply candle spread two weeks ago on a spike of volume, followed last week by a much smaller supply candle spread on even greater volume. This tells us that, last week, supply exerted more effort but received much less result than the previous week. This often denoted the bottom that results in a bounce at the least.
Breaking out impulsively above the daily pivot, and closing above it, has an initial target of 4.2490. Further rally has targets of 4.5820 and the weekly R1 pivot area at ~4.8455. But a breakdown below the weekly pivot will give us a target of the green demand structure, most likely near the daily S1 pivot at ~3.8375.
Final Thoughts
Market bears are getting pretty excited about the recent pullback. Especially with the surprise jobs numbers last month. But, for now, that’s all it is - a pullback. As I mentioned, the decline in the wages number has tempered that upside surprise.
Nothing technical has happened to signal that we should be concerned about a drop below November 2022’s swing low. That doesn’t mean it can’t get happen, but as a technical analyst, you have to move beyond your personal bias and emotions and find technical reasons for what you believe will happen. If Core CPI MoM just prints in-line with expectations at 0.4%, we are likely to see a strong sell-off of the dollar and resumption of the rally by risk assets. Buy the rumor, sell the news. Furthermore, copper is lining up for a possible push higher as well. Generally, as copper goes so does the market. So, a rally in this metal should see the markets rallying as well.
By the way, if you are on Facebook, be sure to like and follow my public page at facebook.com/ChristopherInksLIVE as we will be doing some pretty cool things on that platform throughout this year. I’d love for you to be a part of it.
My Streaming Schedule
Simulcasting on Tuesdays and Fridays
11:00 a.m CST


