Stocks Up, Bitcoin Up, Gold and Silver Up. Life is Good!
That doesn't mean that price won't pull back before rallying higher though, so pay attention.
Be sure to catch the latest episode of the Weekly Market Breakdown…
…and my weekly podcast Beards and Bitcoin airing on Wednesdays at 11 a.m. CST as Andrew and Tillman join me each week to discuss Bitcoin price, news, miners, and institutional insights.
Unleash Your Trading Potential: Insights and Opportunities in Today's Market
Hey there, fellow traders! Welcome to your go-to source for the latest and greatest in the world of trading. Whether you're deep into the crypto game or navigating the stock market, we've got the insights you need to stay ahead of the curve. Here are the stories that are shaping the financial landscape right now.
Silver's Steady Path: Discover why silver is holding strong with no fundamental downside, even as the market faces deficits. Read more.
Bitcoin ETF Inflows Surge: Investors are pouring $556M into spot Bitcoin ETFs. Find out what this means for the market. Read more.
SEC Approves Bitcoin Options ETFs: The SEC has given the green light for Bitcoin options ETFs on the NYSE and CBOE. Here's what you need to know. Read more.
FBI Cracks Down on SEC Hack: The FBI has made arrests in connection with a hack involving Bitcoin. Get the full scoop. Read more.
Bitcoin's Wealth Power: Nearly 50% of crypto millionaires owe their success to Bitcoin. Explore the impact of BTC on wealth creation. Read more.
Meme Coins on the Rise: Meme coins are outpacing Bitcoin gains. Dive into the wild world of meme coin trading. Read more.
S&P 500's Winning Streak: The S&P 500 sets a record for the longest weekly win streak of 2024 as Netflix surges. Check out the details. Read more.
Get TWC Trading Academy’s Group Coaching for only $97/m ($77/m if you’re fast enough)!
You read that right! We've offered elite, high-value group coaching at $3997/year for years, and traders have paid it because it's worth every penny. But now we're about to flip the script and do something that'll change everything in order to give greater access to even more people who want to learn how to put the trading odds in their favor.
Our group coaching will include our TWC Traders Club and, for the first time ever, FiboSwanny’s Threshold Theory access as well. These two services normally go for $50/m and $34/m separately!
There is NO BETTER trading education anywhere else! If you want to be the hero in your own trading story, then sign up today! There are no games nor gimmicks in this offer.
Want to be a part of it? Check out the info at texaswestcapital.com/97gc. And to make things even better, all we need is another 15 people to join the waitlist so that we can launch the new pricing early than we mention on the site!
Stock Indexes
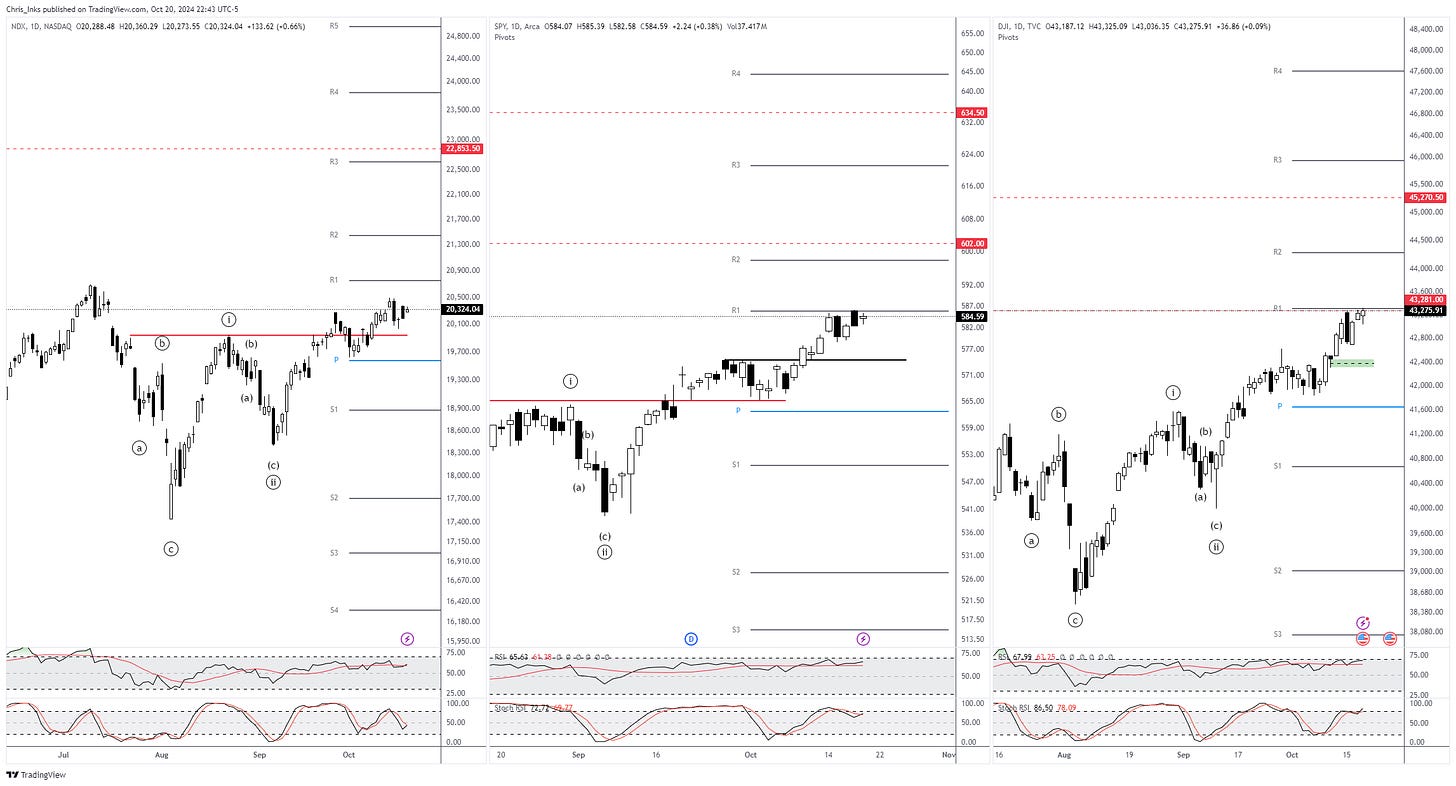
It was a sideways week for the most part with the SPY and DJI printing very slight new ATHs. We need to see a rally above 20690.97 for the NDX to print a new ATH. There is room in the daily RSIs and Stoch RSIs for the indexes to rally higher this week so I will be looking for those break outs.
Bitcoin ETF Flows
Last week was a huge week for the Bitcoin ETFs. We saw a total net inflow of 2129.6M with no outflows at all. Is this a sign of things coming with Bitcoin price nearing its ATH now?
Bitcoin
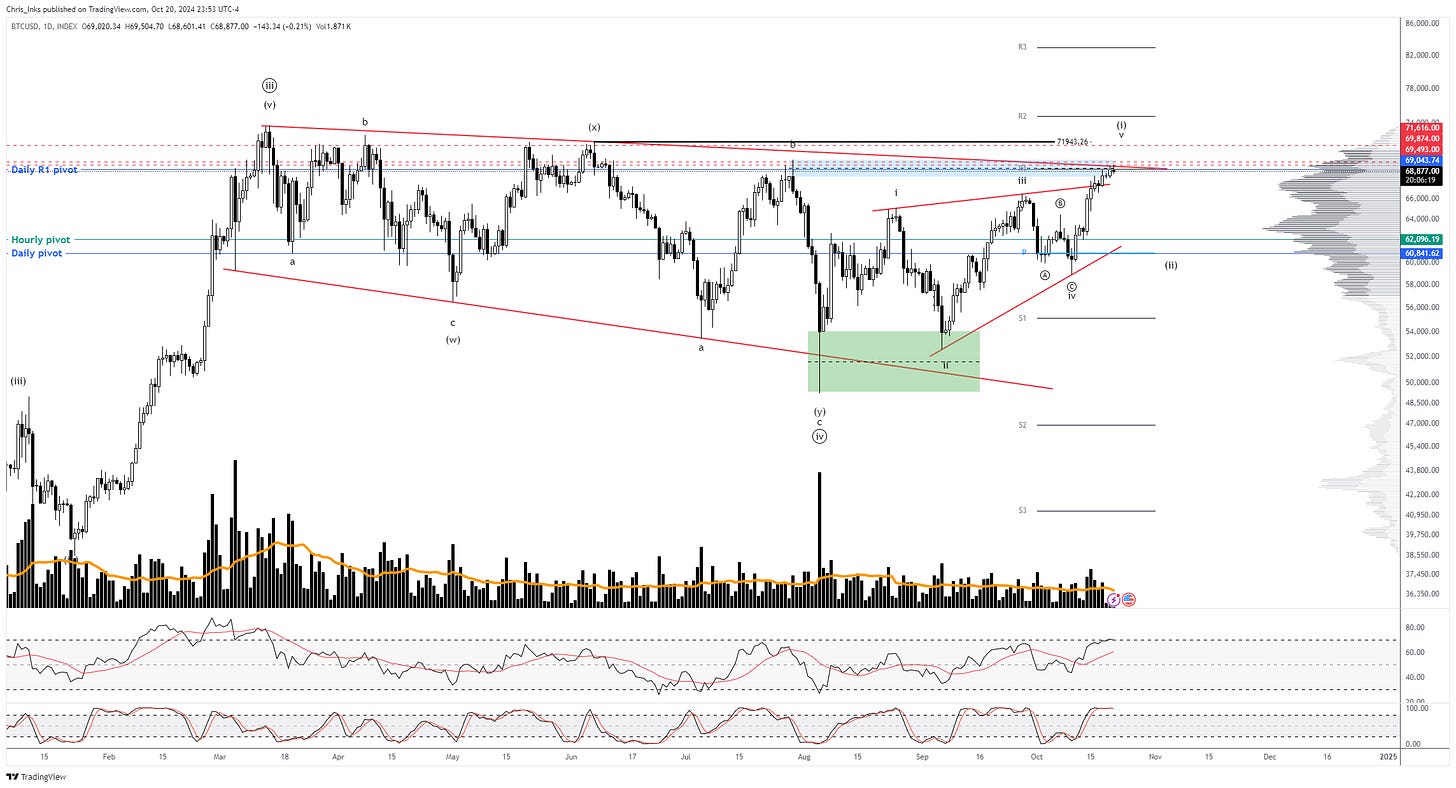
I have been saying that the primary expectation is to see price rally beyond the R1 pivot, near the ATH, and then pull back into the blue daily pivot area. From there we should then expect to see the rally that breaks out into a new ATH. However, I think the earliest that we would likely see that new ATH would be toward the end of October. And price is currently working on that. It rallied into the descending resistance off the ATH around the blue demand structure and daily R1 pivot confluence area. So, we could still see it push up a bit higher toward the ATH before pulling back. However, we are seeing price stall for the moment at this technical resistance area and I’m not a fan of buying resistance.
As mentioned previously, price broke out above the wave ((B)) extreme at 61202 on the Bitcoin All Time Index chart which signals that wave ii is likely complete and that wave iii is in progress toward a minimum expected target of 82478. The larger degree wave ((v)) has a target of 93654 based on the height of wave ((iv)).
If this cycle is to end like every cycle before, then we should expect wave ((v)) to overextend much higher. Based on previous cycles, we should also not expect it to end until Q4 of 2025. However, there’s a lot of things that need to happen in the meantime to make that a reality so we will continue to trade the chart as it prints rather than tell it what it needs to do.
You can subscribe to the weekly Bitcoin Miner Stocks Report newsletter where you will get the week’s information and news regarding this sector, commentary, and most importantly updated charts of 15+ public bitcoin mining companies. Subscribers have been able to jump in on some big moves as they were well-positioned before the stocks popped. And as of late they’ve been able to wait for their entry as the miners have corrected more recently. The next issue will go out Monday evening.
*If you are one of the few TWC lifetime members, this subscription is included in your membership. So, send me a quick DM to make sure I get you subscribed.
Ethereum ETF Flows
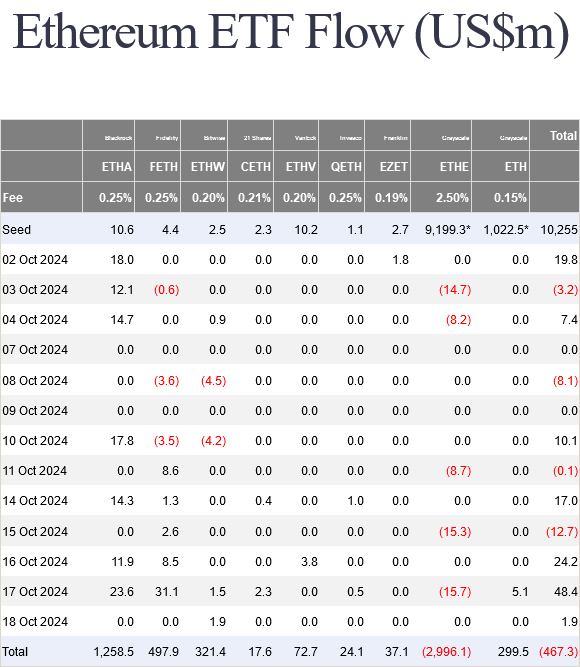
The Ethereum ETFs had a good week with the only outflows coming from Grayscale’s ETHE product and only on two of the days. The ETFs had a net inflow of 78.8M as buying interest joined the overall cryptocurrency bullishness.
Ethereum
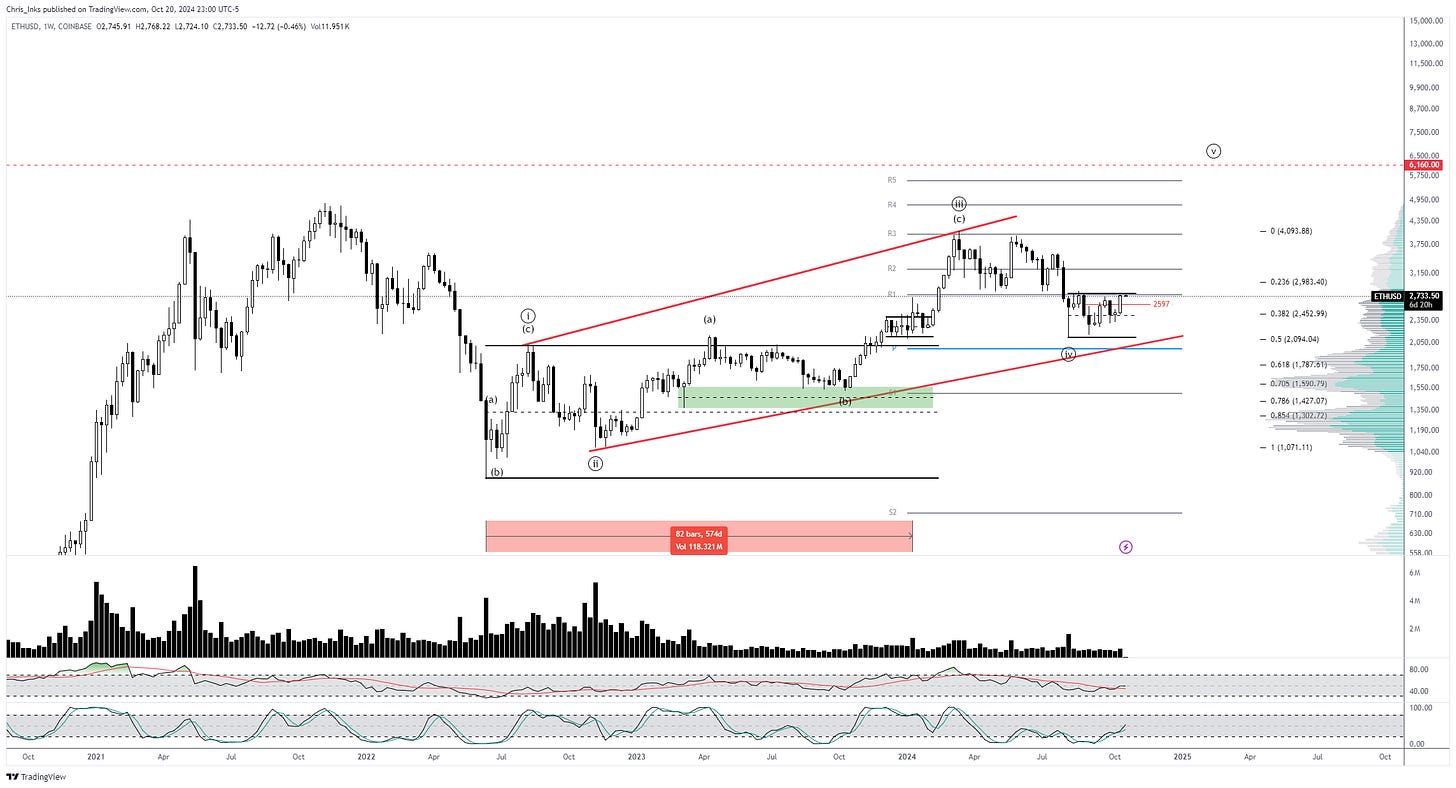
Price is currently up around ~$90 above last week’s close. RSI and Stoch RSI on this weekly chart have a lot of room for price to continue to run higher.
Spot Ethereum rallied along with the net inflows of the Ethereum ETFs last week. The weekly candle pushed up into the resistance around the weekly R1 pivot. We have higher lows consolidating price toward that resistance in the form of an ascending triangle which suggests a pop higher is likely to happen soon.
The bigger picture continues to look like price is printing a diagonal with wave ((iii)) terminating at the cycle high of 4093.88 and wave ((iv)) possibly being complete at 2116.02. Breaking down below that low will keep wave ((iv)) alive with an initial target of the weekly pivot at 1970 or secondary target of 1787. Breaking out above 2820.86 will be the first clue that wave ((iv)) may be complete. Further break out above 3563.02 will make it much more likely.
Wave ((v)) has an expected target of 6160 based on the current height of wave ((iv)).
Gold Futures (GC1!)
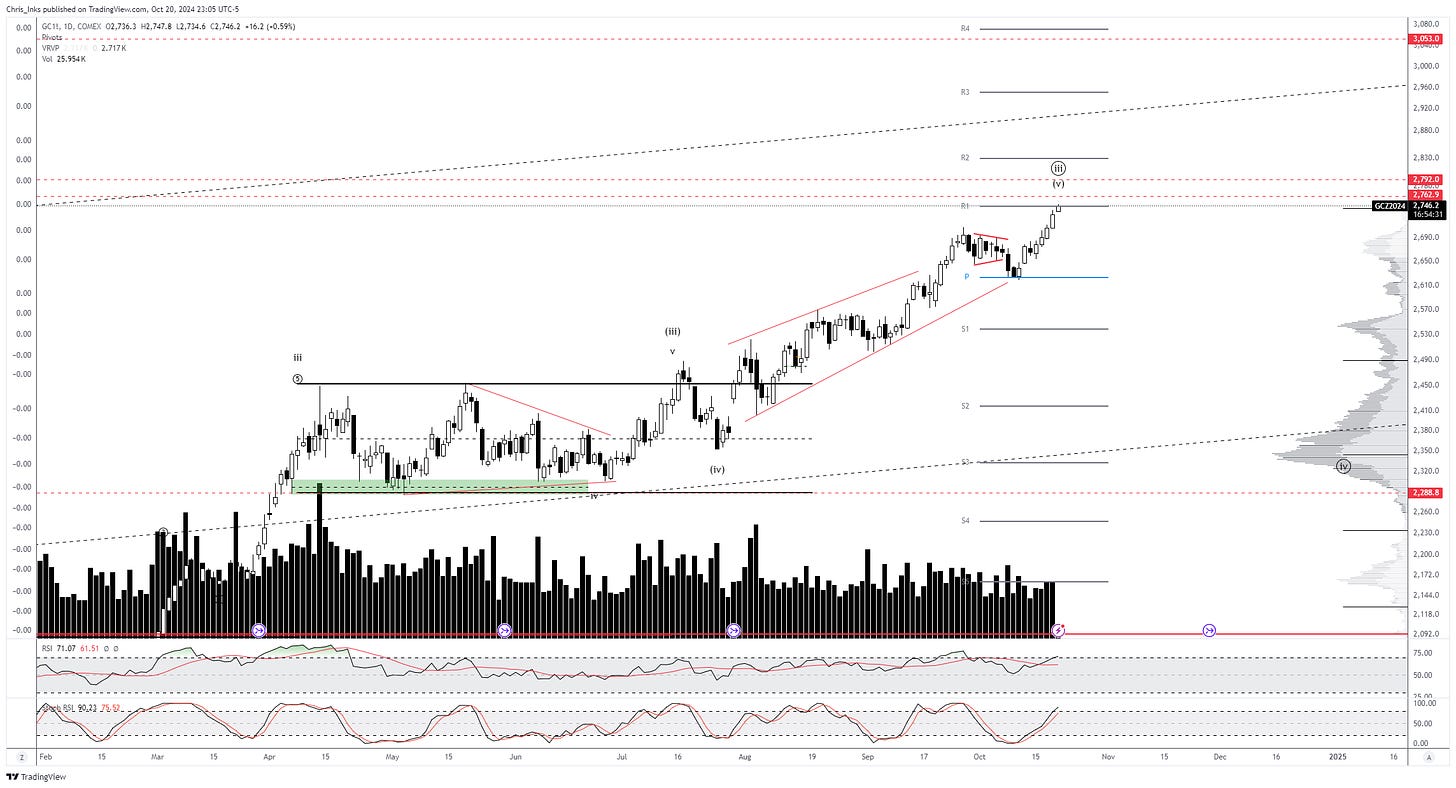
Gold has almost reached the initial target of 2762.90 which is based on the height of the pullback from September 26th. However, I believe we are likely to see a local pullback from that area before price rallies higher once more toward 2792 at least.
The US Dollar Index (DXY)
The DXY was rejected at the 61.8% retracement level and has dropped below the ascending red support. We want to see an impulsive movement following through lower now. Continued rally has a target of the order block denoted by the orange range.
Markets are never wrong – opinions often are.
— Jesse Livermore
Chart of the Week
The macro bottom may be in on SNOW.
Locally, it looks like wave iv is complete at the 50% pullback of wave iii. That will give us a pattern target of 133.25 for wave v of (i) based on the height of wave iv. Breaking out above 123.96 will add confidence to the count.
Join me as I co-host spaces with Gary Cardone and Samuel Armes every Monday at 4 p.m. CST/5 p.m. EST. And, also, as I join Scott Melker every Wednesday at 8:30 a.m. CST/9:30 a.m. EST with some of the more interesting charts of the day.
My Schedule
Beards and Bitcoin simulcasting on Wednesdays
11:00 a.m CST
Market Analysis simulcasting on Fridays
11:00 a.m CST
DISCLAIMER: This newsletter is intended solely for educational purposes and should not be construed as financial advice. It does not constitute an investment recommendation or a solicitation to buy or sell any assets. Please exercise due diligence and conduct your own research before making any financial decisions.
The Market Breakdown newsletter does not operate as a registered investment advisor. This document is provided purely for informational purposes and does not constitute an offer or invitation to buy or sell any financial instruments. The viewpoints expressed are derived from historical data analysis and are deemed reliable, though their accuracy is not assured. Readers are entirely accountable for any decisions made based on this information.
CFTC RULE 4.41 - These results are based on simulated or hypothetical performance results that have certain inherent limitations. Unlike the results shown in an actual performance record, these results do not represent actual trading. Also, because these trades have not actually been executed, these results may have under-or over-compensated for the impact, if any, of certain market factors, such as lack of liquidity. Simulated or hypothetical trading programs in general are also subject to the fact that they are designed with the benefit of hindsight. No representation is being made that any account will or is likely to achieve profits or losses similar to these being shown.


