Cryptos rally impulsively as inflation continues to decelerate
Where Bitcoin goes, so goes the crypto market
Inflation continued to decelerate in December for the sixth month in a row. The December CPI report, releasted last thursday, notched an annual rise of only 6.5% as was the consensus expectation. This was a drop of 0.1% from the previous month, and a significant drop from the 9.1% peak earlier last year.
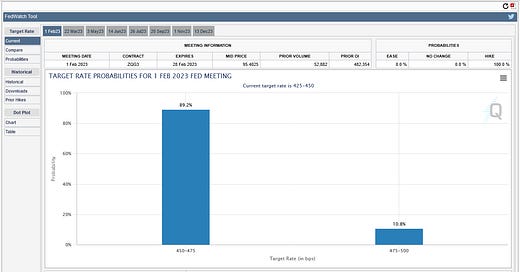
The CME FedWatch tool shows the market currently pricing in a target rate probability of a 25 bps rate hike at 89.2%. However, remember that the Fed’s preferred inflation gauge is the PCEPI, which will be released on January 27th. So, anything can happen, but I don’t see it coming in hot at this time. This 25 bps hike would be in-line with my forecast for Q1 2023 from a year ago, so it’s good to see it coming through. Bank of America is saying the Fed will peak at 4.9% by June with rate cuts taking it down to 3% by December. So, the question posed by someone on Twitter was if there is no recession, and employment remains strong, while stocks are rallying and inflation is colling, then why would the Fed cut rates? I would argue that the potential for deflation to arise is the reasoning. Remember, deflation is worse than inflation for debt-based economies since the latter makes that debt cheaper to pay off, while the former makes it much more expensive.
Thread Life
My most recent thread about all things trading, success, and life can be found below. If you enjoy it, could you do me a favor and like and retweet it? If these threads find enough interest through sharing and likes I will create a newsletter expanding more deeply on the threads to help you avoid the pitfalls holding you back in life and trading so that you can concentrate on the things that make a positive difference.

The US Dollar (DXY)
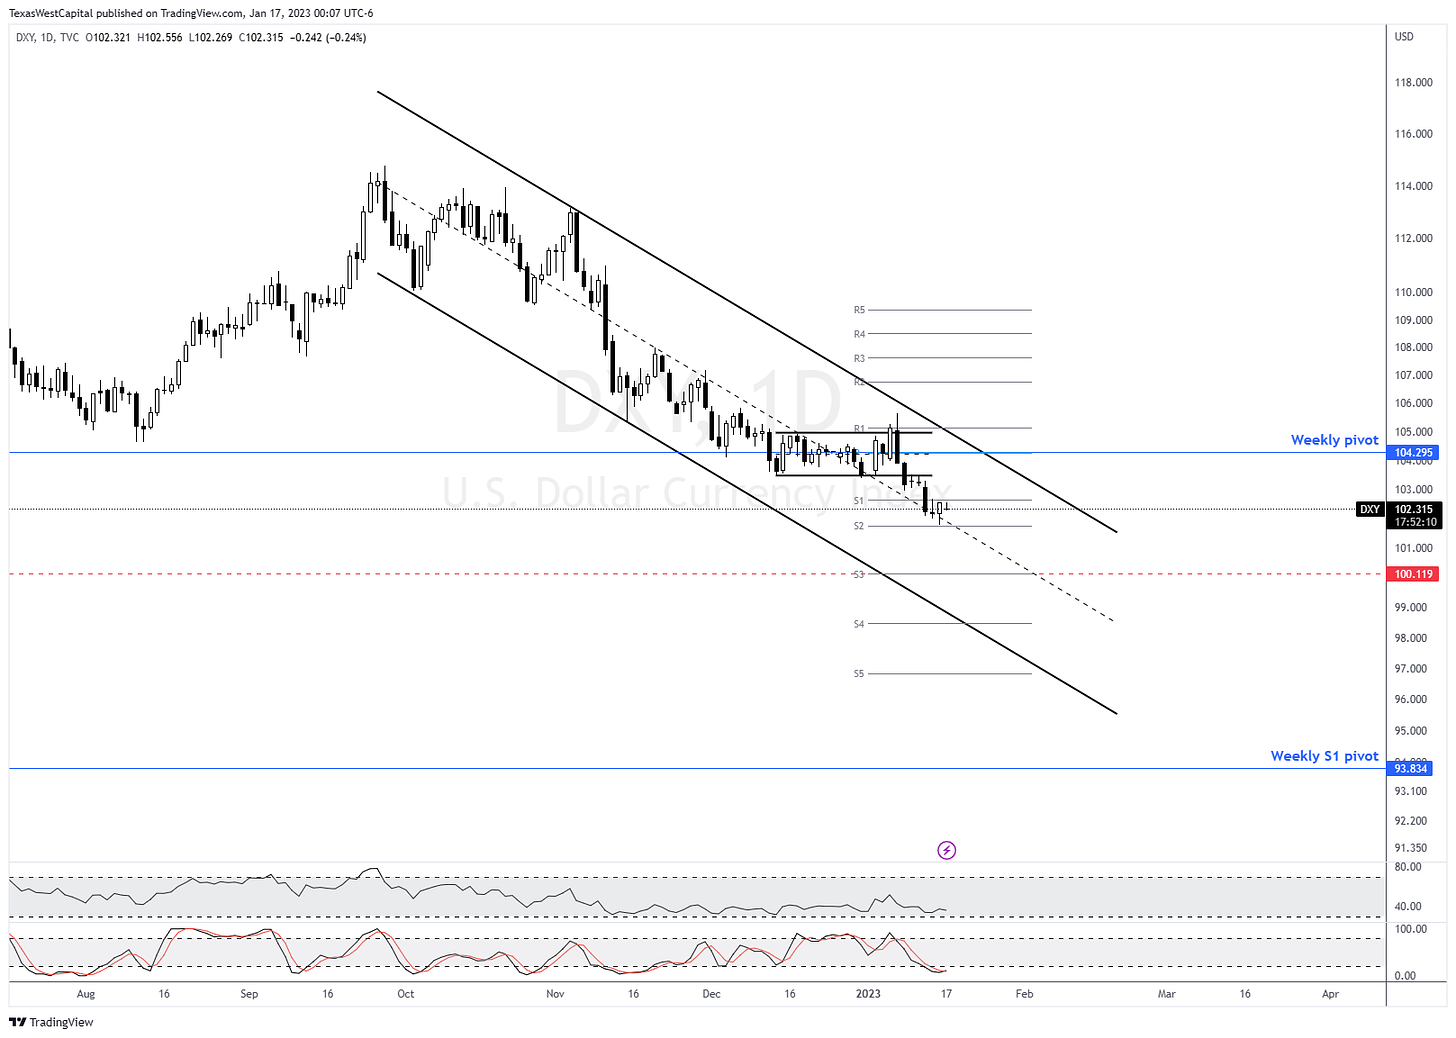
The DXY has continued its fall this past week, in-line with expectations, reaching the daily S2 so far. While it remains below the weekly pivot, traders should continue to look for lowers lows toward the 100 handle. We are likely nearing a low that will give a substantial enough bounce, but we aren’t there yet. So, with the DXY continuing to decline we should expect risk off assets to continue to rally.
Bitcoin Liquid Index (BLX)
As I said last week, there’s little not to like about the Bitcoin chart. Price rallied impulsively, printing a well-overextended wave (iii) which appears to still have one more push higher to complete. Ultimately, wave (v) is likely to target the 24500-25000 area. This will allow a large degree second wave pullback before price rallies through the inefficieny (large candle spreads above 25000 on the left hand side of the chart). This move would be similar to the current 3rd wave rally through the inefficiency that occured with the drop created by the FTX implosion.
My Mission in 2023
My mission this year is to help 10,000 traders become consistently profitable. To that end, TWC is currently offering 1 month of Tier 3 access for only $19.99! That’s a savings of $180 off the normal month-to-month price! No autorenew, so there’s no need to worry that you will be charged again in a month if you don’t remember to cancel. If you do like what you see and choose to stick around, we will be offering you a pretty sweet deal. But if not, that’s okay, too. Just make sure you absorb all the content you possibly can while you’re with us.
Click here to sign up with TWC today!
Ethereum (ETH/USD)
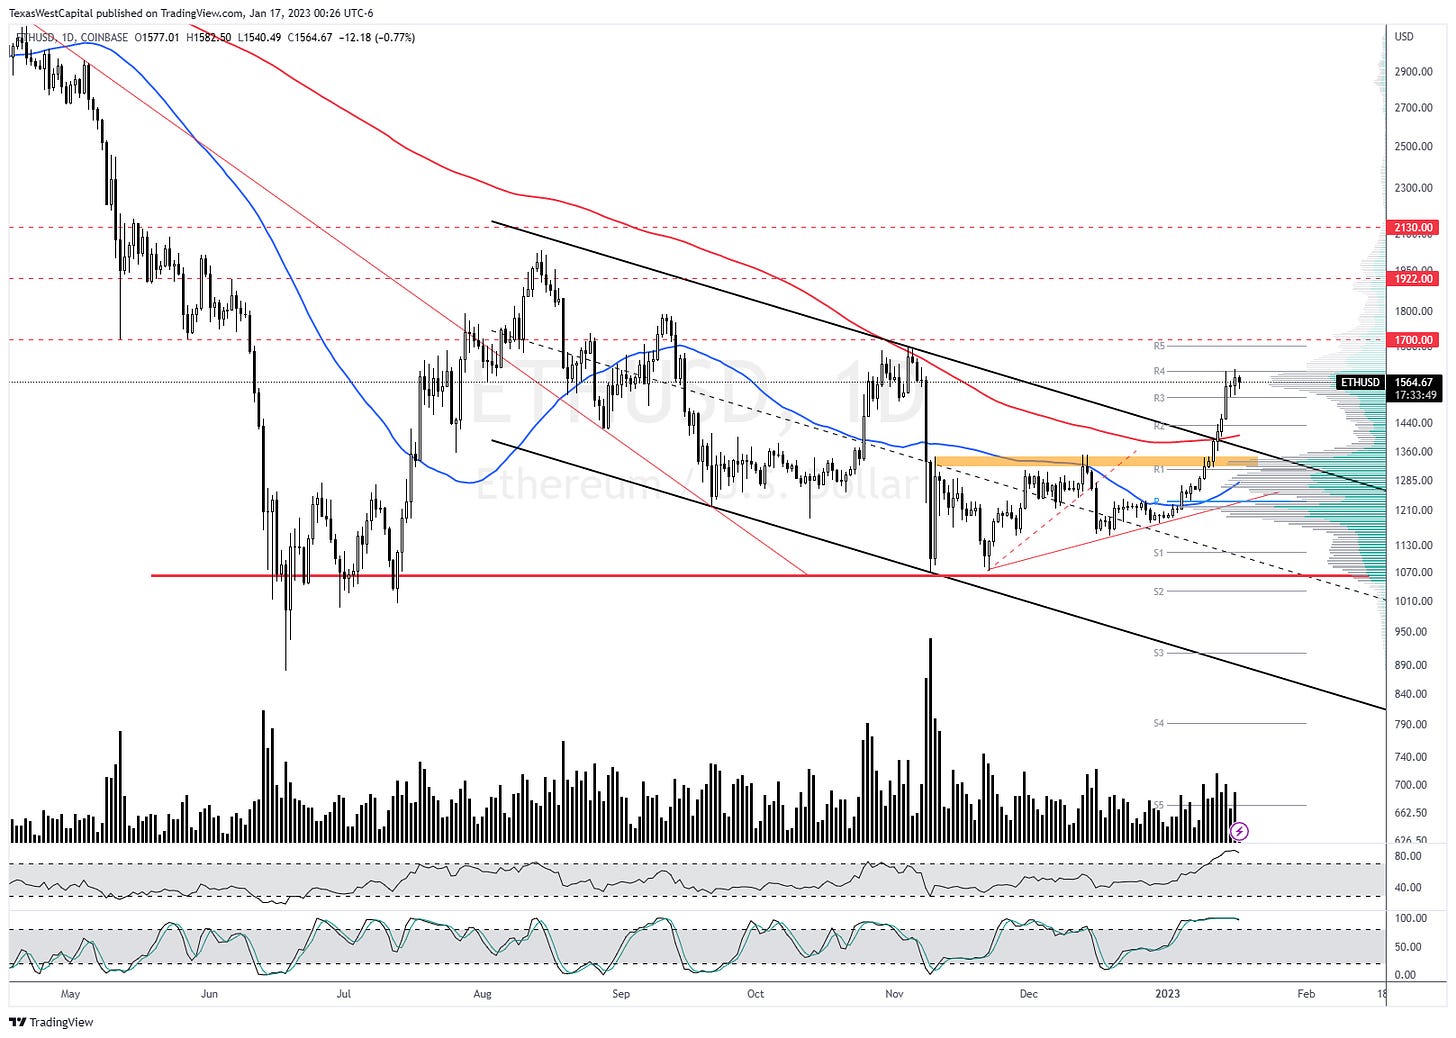
Ethereum had no chill either this past week. Rather than pullback toward the daily pivot to gather energy for the breakout, it just ran. The breakout has carried it to the HVN just prior to the R4 pivot, where it is consolidating, so far. Last week I i said that price was likely targeting the R5 pivot, at a minimum, due to the impulsively breakout above the daily pivot and rally into the R1. We are almost there. I have adjusted my three targets to 1700, 1815.50, and 1987 (this latter one could push into 2000).
S&P E-Minis Futures Contracts (ES1!)
The Dow broke out above its mid-August swing high already. But the S&P and Nasdaq are lagging and haven’t confirmed that breakout yet. Much like the Dow, they are both printing a possible abc correction. Breaking out above that swing high (labeled wave B in this chart) will confirm the Dow’s breakout and signal that we are likely going to see new ATHs. If so, then the path I have outlined in the chart is, generally, what I believe we will see. While the S&P remains above its daily pivot our sights should be set on higher highs.
Final Thoughts
We continue to see deceleration in inflation which keeps the dollar weakening leading to an increase in risk assets. I see many people on social media fighting this deceleration because they think we absolutely must fall into a recession and that the Fed must continue to raise rates into 5% and greater. The problem with thinking along those lines is that you continue to miss all the shorter-term trading opportunities. At the end of the day, are you a trader or not? If so, then the longer-term macroeconomic outlook shouldn’t keep you from day trading. The goal, as a trader, should be to consistently lock in profit. Period.


My Streaming Schedule
I stream simultaneously on YouTube.com/texaswestcapital, Twitch.tv/texaswestcapital, and Twitter.com/txwestcapital on Tuesdays and Fridays at 11:00 a.m. CST. I’d love for you to stop in and share your thoughts about the charts. We usually look at everything from Bitcoin to stock indexes, Forex to precious metals, oil and gas to individual stocks and crypto pairs as well as the DXY. And of course I do my best to explain the macro events and what they likely mean, which is often much different than the usual large social media influencer accounts.


